FEATURE / 08
·
ANALYTICS & REPORTING
·
LIVE DASHBOARDS
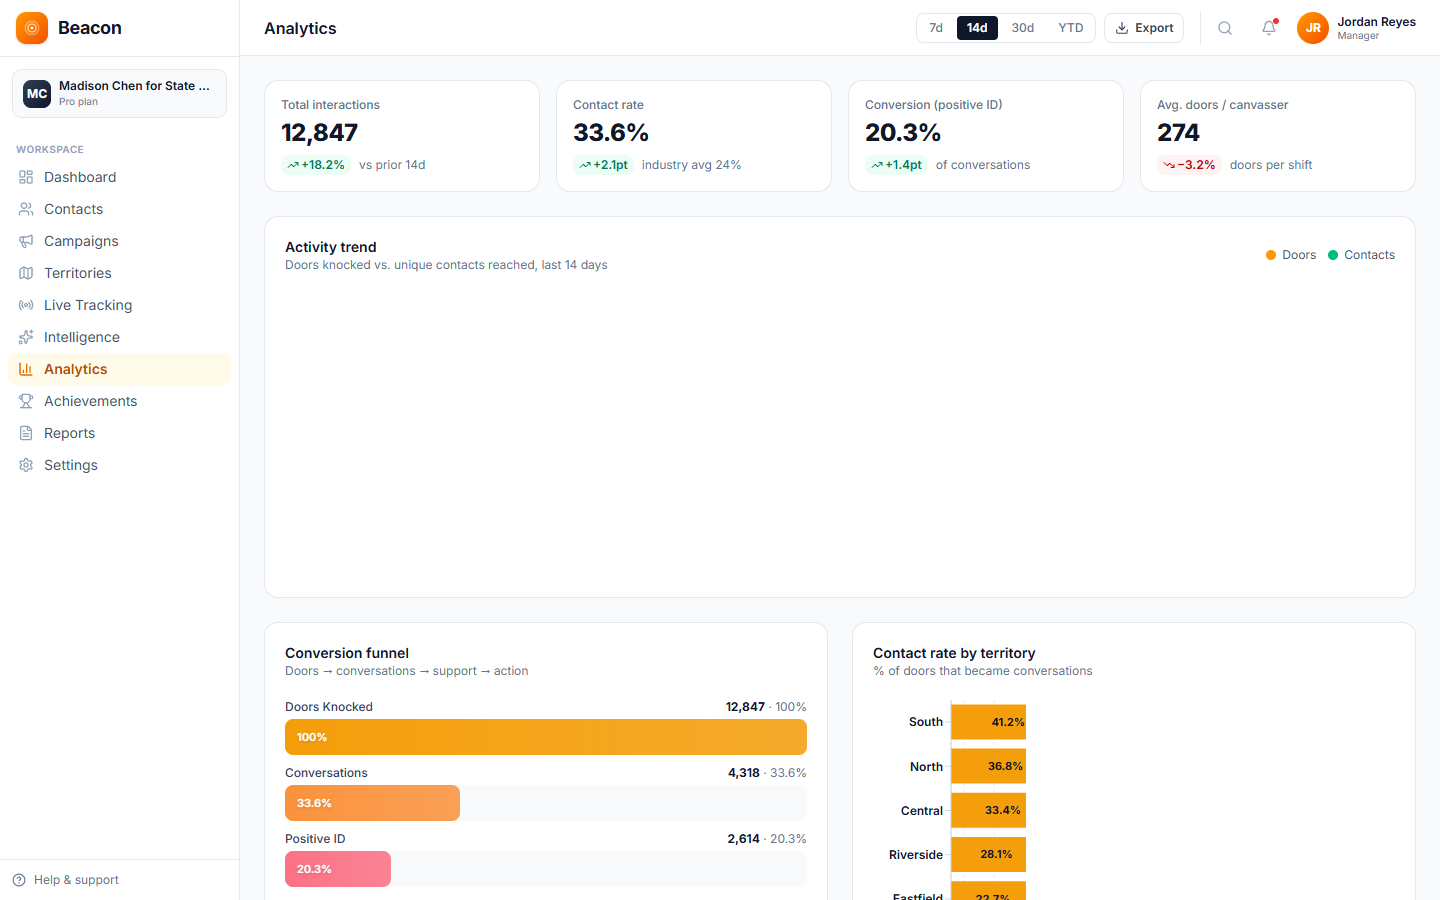
Canvassing analytics & reporting — measure everything, report effortlessly.
Doors knocked, contact rate, conversion. Trend charts, conversion funnel, contact-rate by territory, top performers. Real-time. Filterable. CSV export to anywhere. Included on every Beacon plan.
CAMPAIGN ANALYTICS · KPI · FUNNEL · TURFS